Category: analytics

#MakeoverMonday Week 9 dataviz submission

This week’s dataset was from European Institute for Gender Equality and shows the proportion of seats held by women in European parliaments and governments. Another great dataviz learning experience and on the whole I’m OK with the finished product this week, I know I still have a big journey ahead of me to create some…
Read more

Learning dataviz with Makeover Monday

I’ve been meaning to take part in Makeover Monday for some time as a way to improve my data storytelling skills. This weekly learning event has been running for a year or so and I love its simple but effective format: a data vizualisation and accompanying dataset is released at the start of each week…
Read more

A vendor view of Learning Technologies 2017

I spent two days last week at the Learning Technologies 2017 exhibition, working on the LEO stand (below). This annual event is split over two floors, with a paid conference upstairs and free exhibition downstairs. The stand was really busy for both days and the whole team came away absolutely exhausted, but I did manage…
Read more

The quantified cyclist: analysing Strava data using R

This post was edited on 09 May 2017 to add some clarity around authenticating with the Strava API. In 2016 I made a commitment to myself to record every cycle ride I made. As both a leisure cyclist and cycle commuter, I was keen to know how far I rode in a year, what was…
Read more

xAPI Barcamp – a Learning Technologies fringe event

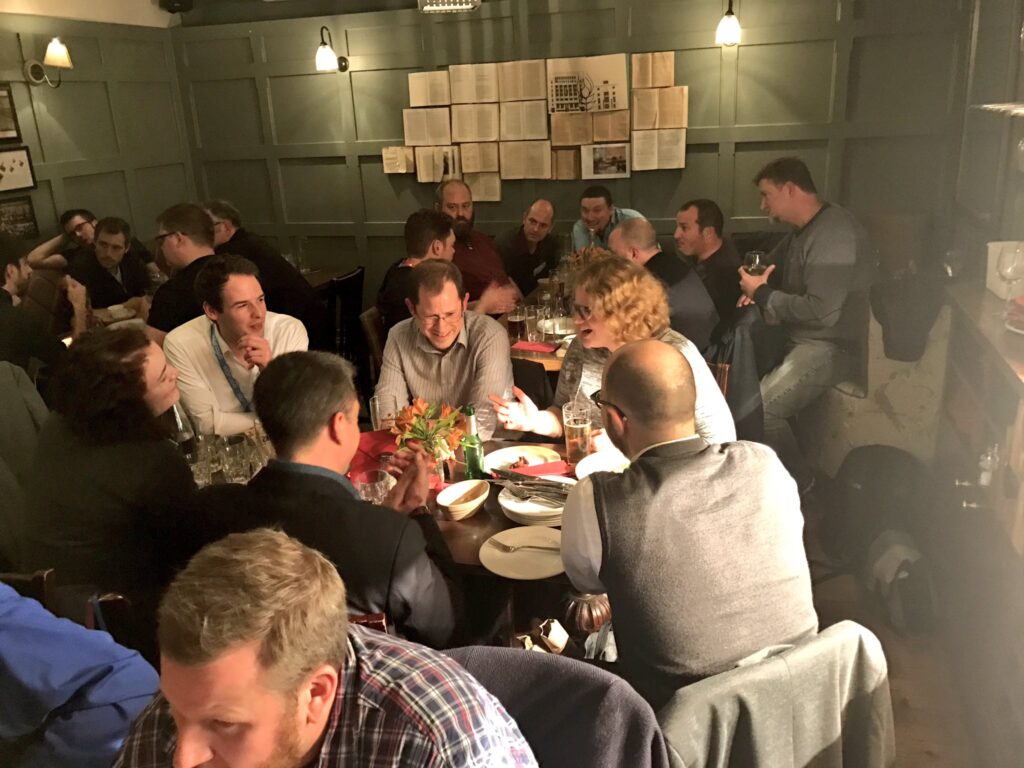
The xAPI Barcamp at the end of the first day of the Learning Technologies conference attracted around fifty people, eager to talk xAPI over a few free drinks at the local pub! I was one of five invited experts alongside Andrew Downes from Rustici (@mrdownes), Mark Berthelemy from Wyver Solutions(@berthelemy), Ben Betts from Learning Locker…
Read more